Getting to Know Your Repository with git-spark
git-spark turns a repository's commit history into an interactive report, a health check, and sprint comparisons. This walk-through covers the 2.0 release, the commands I reach for, and the limits I learned on my own repo.
Development Series — 24 articles
- Decorator Design Pattern - Adding Telemetry to HttpClient
- NuGet Packages: Benefits and Challenges
- Mastering Git Repository Organization
- CancellationToken for Async Programming
- Git Flow Rethink: When Process Stops Paying Rent
- Understanding System Cache: A Comprehensive Guide
- Guide to Redis Local Instance Setup
- Creating a PHP Website with ChatGPT
- TaskListProcessor - Enterprise Async Orchestration for .NET
- Harnessing the Power of Caching in ASP.NET
- Fire and Forget for Enhanced Performance
- Building Resilient .NET Applications with Polly
- The Singleton Advantage: Managing Configurations in .NET
- Troubleshooting and Rebuilding My JS-Dev-Env Project
- Generate Wiki Documentation from Your Code Repository
- My Journey as a NuGet Gallery Developer and Educator
- Architecting Agentic Services in .NET 9: Semantic Kernel
- The Building of React-native-web-start
- TailwindSpark: Ignite Your Web Development
- Evolving PHP Development
- Modernizing Client Libraries in a .NET 4.8 Framework Application
- Building Git Spark: My First npm Package Journey
- Dave's Top Ten: Git Stats You Should Never Track
- Getting to Know Your Repository with git-spark
Filed under Pragmatic architecture and modernization
Topic cluster
Software Development Patterns.NET development, API integration, implementation patterns, and the trade-offs that show up in working code.
The record nobody reads
Every repository keeps a detailed record of how it was built: who changed what, when, how often, and how much. Most of the time that record gets opened one commit at a time with git log, so the larger patterns stay hidden. Which files keep changing? Does the work come in a steady stream or in bursts? How many people could keep this project alive?
I built git-spark to answer those questions from the history alone. It started as a weekend project and became my first npm package, a story I told in Building Git Spark. It's an open-source Node.js CLI and library. One command produces a self-contained, interactive HTML dashboard. Others give a quick health check, compare sprints, or export raw data for your own tooling.
It relies only on Git commit data. It doesn't connect to your issue tracker, CI, or code host, and every metric says what Git can and cannot tell you. That rule hasn't moved since the first release. What has moved is everything around it, so this is a walk through the 2.0 line and the commands I reach for when I want to know a repo.
What changed in 2.0
Version 2.0.0 shipped in October 2026, and 2.0.2 followed on November 21. For anyone upgrading, three changes matter.
The breaking one is the runtime. git-spark now requires Node.js 26 or newer, up from 22. If an older CI image pins Node 22, the install will fail until it moves.
The periods command is new to anyone on npm. It was built for 1.4.0, but that version's publish failed with an authentication error and never reached the registry, so 2.0.0 is the first published release that has it. The same is true of shallow-clone detection, which warns when a checkout may be missing history.
The rest is correctness. Version 2.0.1 fixed --days silently dropping recent commits when the window reached back past the first commit and local and UTC dates disagreed, which happens in US evenings. It also stopped the install from triggering npm's "install scripts blocked" warning. Since 2.0.2, every release posts a release history page and a GitHub Release from the changelog automatically.
Your first report in about a minute
Every command in this article works the same in bash, zsh, and PowerShell. Check your Node.js version first, since git-spark needs 26 or newer:
node --versionInstall the CLI globally:
npm install -g git-sparkThen run it from the root of any repository:
git-spark html --days 90 --openThat analyzes the last 90 days, writes reports/git-spark-report.html, and opens it in your browser. The report is a single file with no external calls, so you can email it or attach it to a ticket. To analyze a repository without changing into it, add --repo with its path:
git-spark html --days 90 --open --repo ../some-other-repoIf you'd rather not repeat your flags, save them. This wizard asks how many days to analyze, which output format you prefer, and which file extensions to skip, then writes a .git-spark.json file that later runs pick up (add --yes to accept the defaults):
git-spark initIf a run fails or the numbers look wrong, this checks Git, Node.js, and the repository before you go hunting:
git-spark validateThe HTML report
The HTML report is where I start: one page that answers "what has been happening here?" Its sections, in order:
| Section | What it tells you |
|---|---|
| Current Repository State | Size and shape of the repo today: file extensions, file categories, and a directory breakdown |
| Summary | Commits, contributors, files touched, the Repository Activity Index, and bus factor for the window |
| Top Contributors | Commits, lines changed, and files touched per author |
| Team Activity Patterns | Aggregate patterns such as commit distribution and code volume across the team |
| File Activity Hotspots | The files and directories that change most often |
| Author Activity Details | A profile per contributor |
| Daily Trends | A day-by-day trend chart, a contributions calendar heatmap, and detailed daily tables |
| Measurement Limitations | What these numbers can and cannot tell you |
The page has a persistent dark-mode toggle, "Show more" paging on long tables, and section navigation. Its charts are native SVG with no external libraries. It ships with a strict Content Security Policy that uses SHA-256 hashes instead of unsafe-inline, so it is safe to open from anywhere.
Two flags change what you see. --serve serves the report from a local web server instead of a file, which helps when a browser or security tool blocks local HTML files. --port picks the port (the default is 3000):
git-spark html --days 90 --serve --port 8080--heavy turns on more expensive analyses for a deeper look. Expect it to take longer on a large history:
git-spark html --days 90 --heavy --openA health check in the terminal
When I want an answer without opening a browser, health summarizes the last 30 days in a terminal box:
git-spark healthHere is what it printed on the git-spark repository itself:
🏥 Repository Health Check

Overall Health: 75%
Governance Score: 66%
Risk Level: LOW
Bus Factor: 50%
Active Days: 1
It's a good habit for the first few minutes in an unfamiliar repo: is this project active, and does more than one person work on it? For more detail without the HTML, this prints the full analysis as tables in the terminal:
git-spark --days 30 --format consoleComparing sprints with periods
git-spark periods splits recent history into equal, non-overlapping windows and compares them side by side: commits, churn (lines added plus removed), net lines, files changed, and active authors. --period-days sets the window and --periods sets the count. This compares the last four two-week sprints on the git-spark repo:
git-spark periods --period-days 14 --periods 4Period Date Range Commits Churn Net Lines Files Authors
Period 1 2026-09-26 → 2026-10-10 0 0 +0 0 0
Period 2 2026-10-10 → 2026-10-24 14 52,372 +42,002 426 2
Period 3 2026-10-24 → 2026-11-07 0 0 +0 0 0
Period 4 2026-11-07 → 2026-11-21 7 10,018 +2,590 112 2The table makes the project's rhythm obvious: it moves in bursts around releases. Period 2 holds the 2.0.0 release, with 14 commits and 426 files touched. The two empty sprints are the quiet time on either side.
By default the last period ends now. To line the windows up with your sprint calendar, anchor the last one to a sprint's end date with --until:
git-spark periods --period-days 14 --periods 4 --until 2026-11-14To compare a branch other than the one you have checked out, add --branch:
git-spark periods --period-days 14 --periods 4 --branch developTo drop the comparison into a retro or status update, write it as Markdown (or html) to a folder:
git-spark periods --period-days 14 --periods 4 --output-format markdown --output ./reportsIf the repo is a shallow clone, git-spark warns you, because older periods may be missing commits that were never fetched.
Slicing the history
A whole-repo report answers "what's happening?" Filters answer narrower questions. They're passed straight to git log, so they behave the way Git does:
| Flag | Question it answers | Example |
|---|---|---|
--days / --since / --until | What happened in this window? | --since 2026-01-01 --until 2026-03-31 |
--branch | What's happening on this branch? | --branch develop |
--author | What has this person been working on? Matches name or email, like git log --author | --author [email protected] |
--path | How active is this part of the codebase? | --path src/core |
--exclude-extensions | What does the code alone look like, without docs or lockfiles? | --exclude-extensions .md,.json |
--timezone | When does activity happen in your local time? | --timezone America/Chicago |
Every filter combines with every report command. The recipes at the end of this article put them together into full commands.
--exclude-extensions makes the biggest difference of the set on repos with lots of documentation or generated files. On the git-spark repo, Markdown touches far more files than TypeScript, so excluding .md gives a much truer picture of code churn.
Two options change the tone of the report. --redact-emails hides email addresses, which matters before you share a report outside the team. --teamwork removes the individual contributor sections and keeps the team-level view.
The extension, timezone, redaction, and teamwork flags belong to the main command, so use the --format html form when you combine them:
git-spark --days 90 --format html --exclude-extensions .md --redact-emails --openExporting and automating
The same analysis comes in five formats through --format: html, json, csv, markdown, and console. JSON is the one to use when you want to build on the numbers: chart them in your own dashboard, diff two months, or feed them to another tool. This writes the last 30 days to a data folder:
git-spark --days 30 --format json --output ./dataMarkdown fits neatly into a wiki page or a pull request description:
git-spark --days 30 --format markdown --output ./reportsCSV opens directly in a spreadsheet when someone wants to sort and filter the tables themselves:
git-spark --days 30 --format csv --output ./reportsgit-spark is also a Node.js package. The analyze() helper returns the full report object, which you can query directly:
import { analyze, exportReport } from 'git-spark';

const report = await analyze('/path/to/repo', { days: 30 });

console.log(`${report.repository.totalCommits} commits`);
for (const file of report.hotspots.slice(0, 5)) {
  console.log(`${file.path}: ${file.commits} commits, churn ${file.churn}`);
}

await exportReport(report, 'html', './reports');
For more control, the GitSpark class takes the same options (repoPath, since, until, branch, author, path, timezone, heavy) plus an optional progress callback.
A scheduled GitHub Actions job can produce a fresh report every week and keep it as a build artifact. The one setting that matters is fetch-depth: 0. The default shallow checkout has only the latest commit, so the report would be nearly empty.
- uses: actions/checkout@v4
  with:
    fetch-depth: 0  # full history
- uses: actions/setup-node@v4
  with:
    node-version: '26'
- run: npm install -g git-spark
- run: git-spark --days 30 --format html --output ./reports
- uses: actions/upload-artifact@v4
  with:
    name: git-spark-report
    path: ./reports/
git-spark does this for itself: each release tag regenerates the live sample report on its docs site.
Reading the numbers honestly
The rule I built git-spark around is that it never invents a metric Git can't support, and each report ends with a section on its own limitations. The most useful thing the report teaches is often what not to conclude.
Git can't see code reviews, pull request metadata, issues, deployments, test results, team structure, or actual working hours. A commit timestamp shows when someone committed, not when they worked. Within what Git can see, these are the traps I watch for:
- Identities aren't people. Authors are counted by email address. One developer with a work and a personal email counts as two, and bots such as Dependabot or a docs workflow count too. On the git-spark repo, "5 contributors" is really me under three email identities plus two bots. The reported bus factor of 20% (1 of 5 identities) overstates the team. The real bus factor is 1.
- Bus factor is about churn. git-spark's bus factor is the smallest number of author identities that together account for half of all lines changed. One large generated-file commit can skew it.
- Line counts include noise. Lockfiles, generated reports, and docs inflate churn.
--exclude-extensionskeeps the focus on code. - Merge style hides history. Squash merges collapse a pull request into one commit, so commit counts understate how much review and iteration happened.
- Shallow clones hide history. A CI checkout without
fetch-depth: 0produces a near-empty report.
Two traps in 2.0.2 are my own bugs, and both are already fixed on main for the next release. --path takes a directory, so --path src/core works but --path "src/**" fails validation. And --branch combined with --path analyzes the current branch instead of the one you asked for, so run those two separately until the fix ships.
That bus factor shows the whole problem in one number: correct for what it counted, and still wrong about my project. That gap is why I treat the report as a starting point for questions. It's well suited to onboarding, retrospectives, and spotting risky hotspots. It's poorly suited to ranking or reviewing individual people, a point I made at more length with the Engineering Zoo.
Recipes for common questions
Each recipe is one command, ready to paste from the root of the repository. Values like the dates, path, branch, and email are examples to swap for your own.
I just joined this repo. What matters here?
git-spark html --days 180 --openSix months is long enough to see the hotspots and the regular contributors, and short enough that the picture is still current.
Is this project alive, and who keeps it running?
git-spark healthThe last 30 days in one box: activity, risk level, and bus factor. Read the bus factor alongside the identity trap above before drawing conclusions about the team.
How did this sprint compare with the last three?
git-spark periods --period-days 14 --periods 4Four two-week windows side by side, newest last. Change 14 to your sprint length.
Which files keep changing, ignoring docs and lockfiles?
git-spark --days 90 --format console --exclude-extensions .md,.jsonTerminal tables for the last quarter with Markdown and JSON left out, so the hotspot list shows code churn instead of documentation edits.
What changed in one area last quarter?
git-spark html --since 2026-07-01 --until 2026-09-30 --path src/coreA fixed date range limited to one directory. In 2.0.2, give --path a directory, not a ** glob.
What has one person been working on?
git-spark html --days 60 --author [email protected]Matches name or email the way git log --author does. If someone commits under several emails, run it once per identity.
What happened on the release branch?
git-spark html --branch release/2.x --days 30Analyzes the branch without checking it out. In 2.0.2, leave --path off when you use --branch.
I want a report to share outside the team.
git-spark --days 90 --format html --redact-emails --teamwork --openEmail addresses hidden and the per-person sections removed, leaving the team-level view.
I need the raw numbers for my own dashboard.
git-spark --days 30 --format json --output ./dataThe full report object as JSON, the same shape the library's analyze() returns.
I want a sprint summary for the retro doc.
git-spark periods --period-days 14 --periods 2 --output-format markdown --output ./reportsThis sprint against the last one, as a Markdown table ready to paste into the retro notes.
Try it on two repos
Pick one repository you know well and one you don't, and run git-spark html --days 180 --open on each. On the familiar one, check whether the hotspots and patterns match what you know. That's how you learn which numbers to trust. On the unfamiliar one, you'll have a map of where the activity is within a minute. Where the two disagree with your expectations is usually where the history has something to teach.
The git-spark site has the full documentation, and the source and issue tracker are on GitHub. This article reflects git-spark 2.0.2.
Explore More
- Building Git Spark: My First npm Package Journey — why I built it, and what Git history couldn't tell me about AI contributions
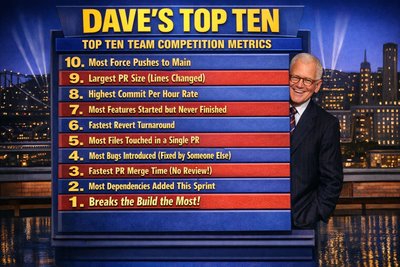
- Dave's Top Ten: Git Stats You Should Never Track — the metrics git-spark deliberately refuses to compute
- The Engineering Zoo — what happens when a dashboard becomes the goal
- Mastering Git Repository Organization — keeping the history worth reading in the first place
Related project evidence
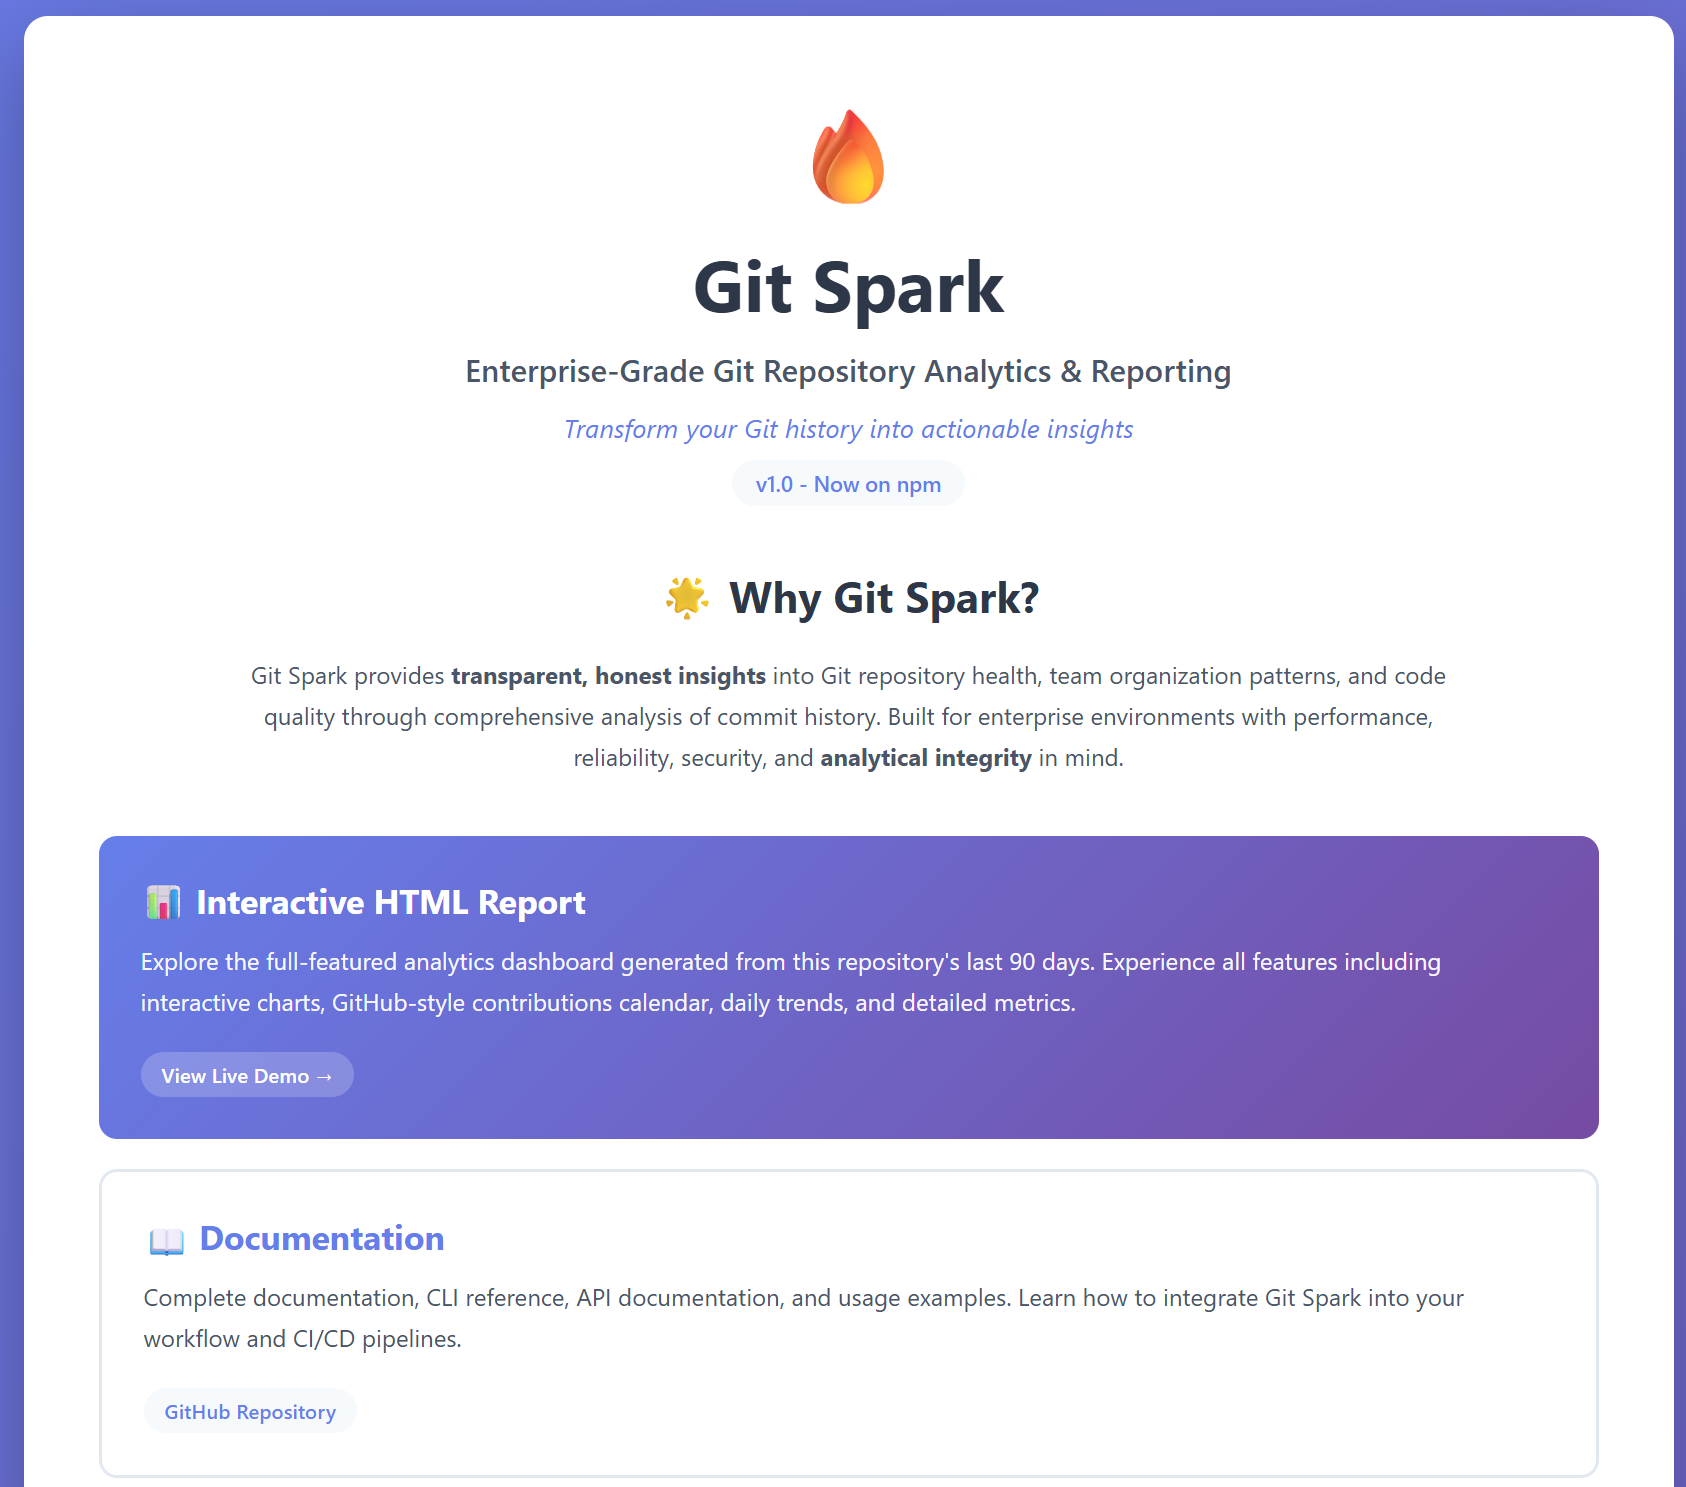
Git Spark: Advanced Git Repository Analytics Tool
Git Spark is an npm CLI tool and Node.js library that analyzes Git repository commit history to provide insights into contributor activity, code changes, and development patterns. Generates interactive HTML reports with charts, plus JSON, CSV, and Markdown exports.
Thousands of npm downloads

GitHub Stats Spark
Automated GitHub profile statistics generator with AI-powered repository analysis, SVG visualizations, and the pipeline that feeds live repository data to this site.
Powers the repository stats on this site
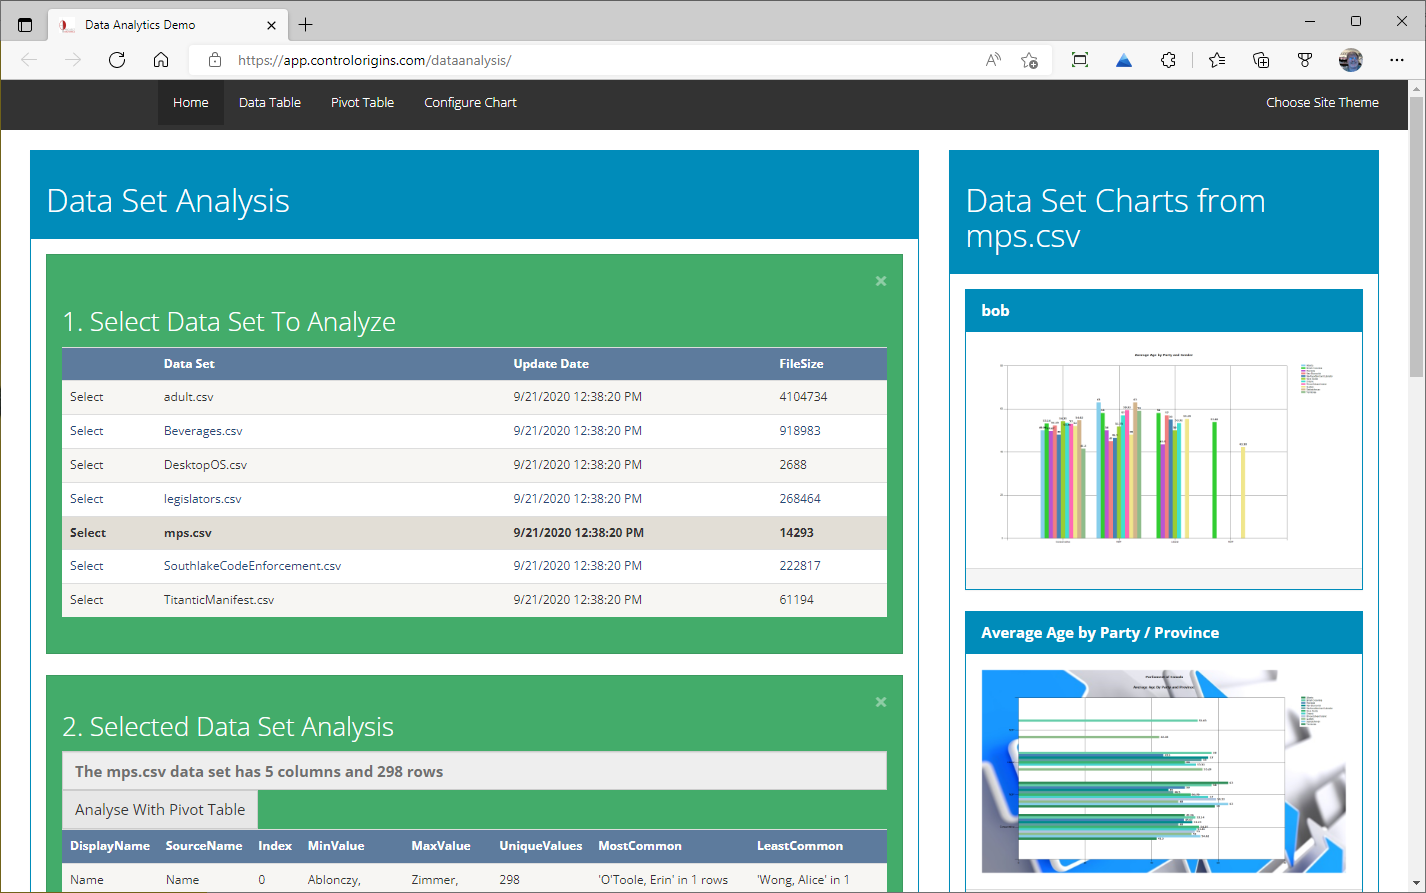
Data Analytics Web Project Manager
DAWPM transforms CSV data into interactive visualizations, pivot tables, and detailed analytics. Built with ASP.NET WebForms 4.8 (VB.NET), featuring a modern Webpack build system, Bootstrap 5.3, DataTables 2.3, D3.js/C3.js charting, and PivotTable.js with drag-and-drop analysis.
Working through something similar?
If this maps to something you're working on, I'm glad to compare notes. Start with the system and the constraint that matters most.