Dave's Top Ten: Git Stats You Should Never Track
Born from a Friday afternoon joke, this Letterman-style top ten list of terrible git competition metrics evolves into a serious look at what git-spark and github-stats-spark actually measure — and why honesty beats authority.
Development Series — 23 articles
- Mastering Git Repository Organization
- CancellationToken for Async Programming
- Git Flow Rethink: When Process Stops Paying Rent
- Understanding System Cache: A Comprehensive Guide
- Guide to Redis Local Instance Setup
- Fire and Forget for Enhanced Performance
- Building Resilient .NET Applications with Polly
- The Singleton Advantage: Managing Configurations in .NET
- Troubleshooting and Rebuilding My JS-Dev-Env Project
- Decorator Design Pattern - Adding Telemetry to HttpClient
- Generate Wiki Documentation from Your Code Repository
- TaskListProcessor - Enterprise Async Orchestration for .NET
- Architecting Agentic Services in .NET 9: Semantic Kernel
- NuGet Packages: Benefits and Challenges
- My Journey as a NuGet Gallery Developer and Educator
- Harnessing the Power of Caching in ASP.NET
- The Building of React-native-web-start
- TailwindSpark: Ignite Your Web Development
- Creating a PHP Website with ChatGPT
- Evolving PHP Development
- Modernizing Client Libraries in a .NET 4.8 Framework Application
- Building Git Spark: My First npm Package Journey
- Dave's Top Ten: Git Stats You Should Never Track
Dave's Top Ten: Git Stats You Should Never Track
It Started on a Friday Afternoon
It was 4:45 PM on a Friday. The sprint was closed, the build was green (for once), and someone in the team channel dropped a casual question: "What if we turned Git stats into a team competition?"
Bad idea. Hilarious idea. The best kind of Friday idea.
Within twenty minutes we had a full draft of the most catastrophically misguided engineering scorecard imaginable — a monument to metrics that look meaningful but actively destroy everything they touch. We called it Dave's Top Ten Team Competition Metrics, and we laughed until we were slightly uncomfortable with how recognizable each item felt.
Then someone said: "Wait. Some of these exist in real tools."
That's when the conversation got serious.
Why This Follows My First Git-Spark Article
In Building Git Spark: My First npm Package Journey, I wrote about failing to measure AI contributions to my codebase — and what that failure taught me about honest analytics. I ended that article with a principle: the best metrics tools don't pretend to have all the answers.
This article is the comedic, then serious, corollary to that. If honest metrics are valuable, then dishonest metrics are actively dangerous — and the dangerous ones are shockingly easy to build.
Dave's Top Ten Team Competition Metrics
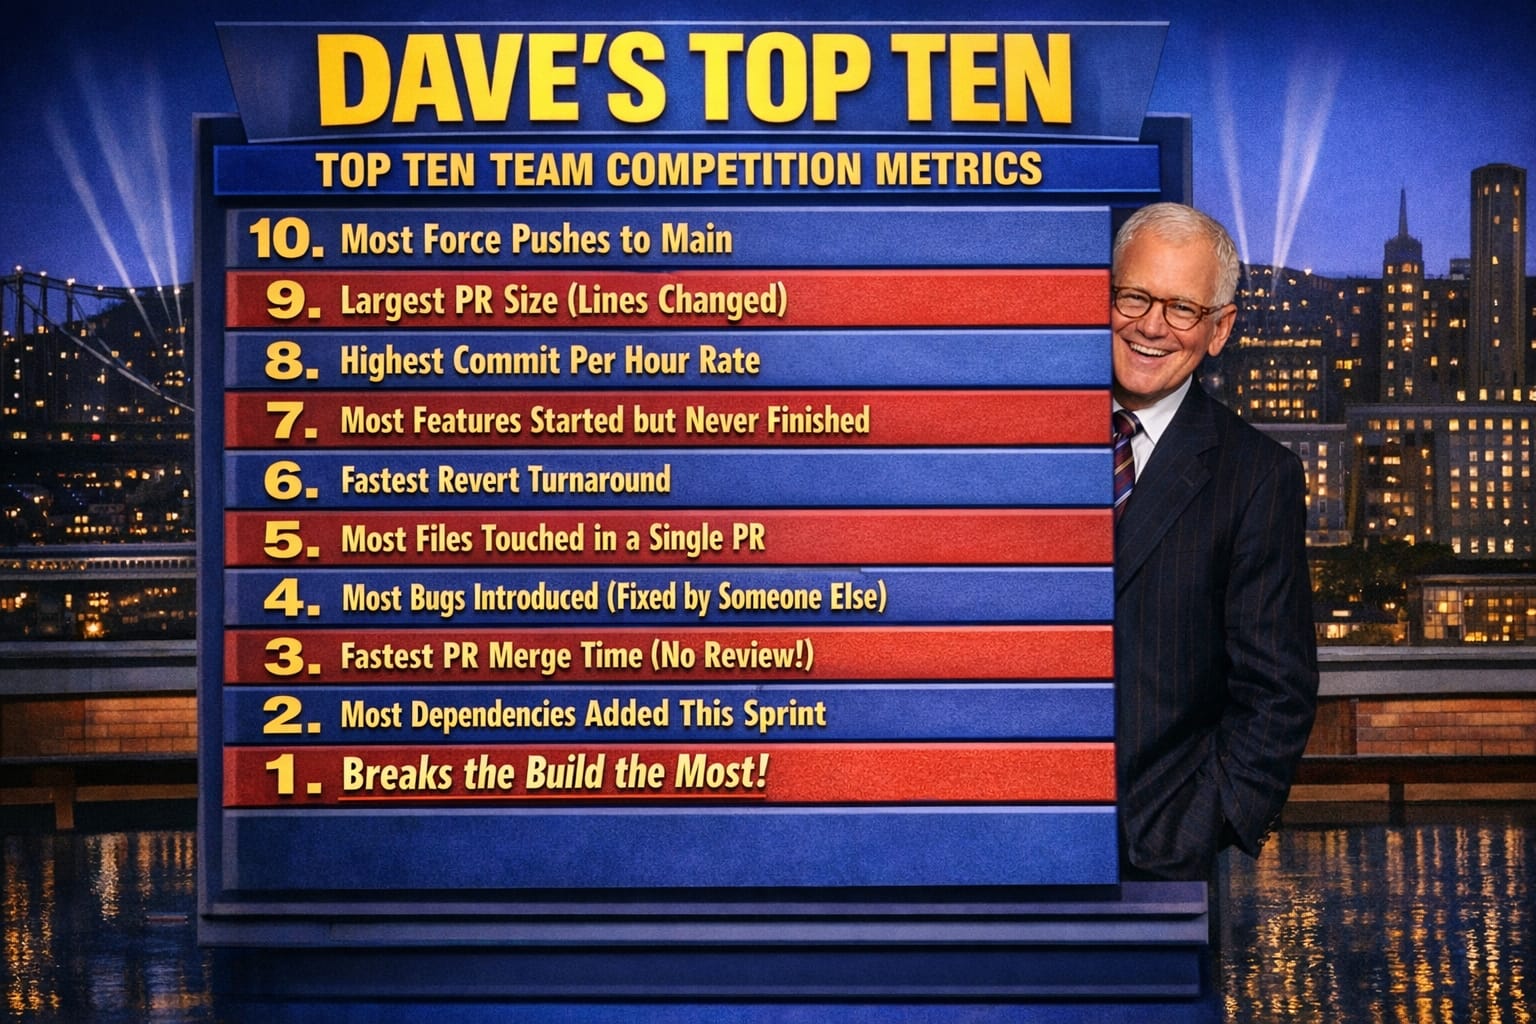
Guaranteed to destroy product stability. Read in Letterman voice.
#10 — Most Force Pushes to Main
Because who needs history, traceability, or team trust? Every rewritten commit is a fresh start. A clean slate. A crime scene with no fingerprints.
#9 — Largest PR Size (Lines Changed)
Nothing signals engineering confidence like a 4,000-line pull request submitted at 4:55 PM on Friday. Reviewers will simply click "Approve" out of self-preservation. This is a feature, not a bug.
#8 — Highest Commits Per Hour
Why think carefully when you can type faster? Deep design? Thorough testing? Those are hobbies for engineers who don't have a leaderboard to top.
#7 — Most Features Started but Never Finished
We prefer the term maximum optionality. Every incomplete feature is a hedge against future requirements. We are not building a product. We are building a portfolio of possibilities.
#6 — Fastest Revert Turnaround
Breaking production is fine — as long as you're quick about reversing it. Bonus points if you broke it, reverted it, and were on a call explaining something unrelated while both happened.
#5 — Most Files Touched in a Single PR
Architecture? Separation of concerns? Module boundaries? These are suggestions, not laws. True engineers touch everything in one heroic, unreviewed commit.
#4 — Most Bugs Introduced (Fixed by Someone Else)
This is team collaboration at its purest. You create the problem. They solve the problem. Everyone grew that day.
#3 — Fastest PR Merge Time (No Review)
Code review is a social construct invented by people who don't trust themselves. Champions merge in under ninety seconds. The CI pipeline is simply a formality they occasionally glance at.
#2 — Most Dependencies Added This Sprint
Why build anything when npm already exists? Every new dependency is a vote of confidence in the open-source community and a gift to the security team that will spend next quarter auditing it.
#1 — Breaks the Build the Most
Ladies and gentlemen, the champion. The apex metric. You didn't just commit code — you stress-tested the team's incident response process. You are not a developer. You are a chaos engineer.
The Moment It Stopped Being Funny
We were still laughing when one engineer pulled up a screenshot from a dashboard their previous company had actually deployed. It tracked PR merge speed. It had a leaderboard. Engineers were being evaluated on it in quarterly reviews.
The fastest PR mergers were also responsible for the three most expensive production incidents that year.
Nobody in that room was laughing anymore.
This is Goodhart's Law in its most destructive form:
When a measure becomes a target, it ceases to be a good measure.
Every item on our satirical top-ten list follows the same failure pattern:
| What You Measure | What You Actually Incentivize |
|---|---|
| Commit volume | Quantity over quality |
| PR speed | Skipping review and testing |
| Lines changed | Bloated, low-signal changes |
| Features started | Starting without finishing |
| Fastest revert | Breaking things faster |
These aren't edge cases. These are predictable outcomes of measuring activity instead of outcomes.
What Git-Spark Actually Measures (And What It Refuses To)
I built git-spark as a single-repository deep analysis tool. The Friday afternoon joke clarified something I'd been circling around in the original article: the tool's value isn't just in what it measures — it's equally in what it refuses to do.
What git-spark surfaces:
- Commit frequency and temporal trends (including zero-activity periods)
- File-level risk assessment: churn rate, author count, recency, and ownership clarity
- Per-contributor patterns without ranking or scoring individuals
- Team specialization signals and potential knowledge silos
- Code coupling — which files always change together
What git-spark explicitly will not do:
- Generate a "productivity score" for any developer
- Rank contributors against each other
- Infer code quality from lines of code
- Claim to measure working hours, effort, or intent
- Pretend any of these patterns are definitive verdicts
The distinction matters. Patterns invite conversation. Scores invite gaming.
When git-spark shows that a single file has been touched by twelve contributors in the last sixty days, that's a signal worth discussing. Is it a hot path everyone depends on? A fragile component nobody owns? A refactor target? The data surfaces the question. The team answers it. git-spark doesn't pretend to know which.
What github-stats-spark Adds Across Repositories
While git-spark goes deep on a single repository, github-stats-spark operates across your entire GitHub portfolio. It runs on a schedule, caches smartly to avoid burning API limits, and generates visual dashboards showing:
- Commit heatmaps across repositories
- Language distribution over time
- Release cadence sparklines
- Repository activity trends side by side
Importantly, it also includes a "Spark Score" — a composite 0–100 health indicator I've thought carefully about. After the git-spark honesty lessons, I document exactly what that score weighs and why, so users understand it as one interpretive lens, not an authoritative verdict. A score is only trustworthy when you can read the formula.
The two tools are designed to work at different altitudes:
| Tool | Scope | Use Case |
|---|---|---|
git-spark | Single local repository | Deep history analysis, risk mapping, contributor patterns |
github-stats-spark | GitHub account / org | Portfolio view, cross-repo trends, activity dashboards |
One zooms in. The other zooms out. Neither produces a leaderboard.
What the Friday Conversation Actually Produced
After the jokes stopped, we ended up with a surprisingly clear list of what Git data can legitimately support:
Risk signals:
- Files with high churn and single-author ownership are fragile
- Infrequent contributors to critical paths are a bus-factor risk
- Long gaps in activity followed by sudden bursts may signal deferred work
Flow signals:
- PR cycle time (not merge speed — cycle time from open to close including review)
- Lead time from commit to deployment
- Rate of unplanned work interrupting planned work
Stability signals:
- Change failure rate (how often do deployments cause incidents?)
- Mean time to recovery (how fast do we resolve them?)
- Test coverage trends over time
None of these appear on the Letterman list. None of them can be gamed easily by individual behavior. All of them are harder to measure than commit count — which is exactly why they're worth measuring.
The Real Takeaway
The Friday afternoon joke was funnier because we recognized the items. Force pushes to main. No-review merges. Giant PRs nobody reads. These patterns exist in real repositories, sometimes rewarded by real incentive structures built by people who genuinely wanted to improve team performance.
The road to a broken codebase is paved with well-intentioned dashboards.
git-spark exists because I wanted a tool I could point at a repository and trust the output. Not because the output is always comfortable — sometimes the patterns it surfaces are exactly the ones teams don't want to see. But because the output is honest about what it knows and what it doesn't.
If your metrics dashboard looks like a video game leaderboard, you're probably not measuring engineering performance. You're designing failure with extra steps.
Try Both Tools
git-spark — deep single-repo analysis:
npx git-spark analyzeor install globally: npm install -g git-spark
github-stats-spark — portfolio-level GitHub dashboards, available at github.com/markhazleton/github-stats-spark.
Both are open source, early-stage, and actively seeking feedback. The goal for both is the same: honest signals, documented limitations, and trust you to bring the context.
Explore More
- Building Git Spark: My First npm Package Journey -- A Weekend Project, AI Agents, and Learning What Git Can't Measure
- Decorator Design Pattern - Adding Telemetry to HttpClient -- Adding Telemetry to HttpClient in ASP.NET Core
- NuGet Packages: Benefits and Challenges -- Exploring the Pros and Cons of NuGet Packages
- Mastering Git Repository Organization -- Enhance Collaboration and Project Management with Git
- Guide to Redis Local Instance Setup -- Master the Setup of Redis on Your Local Machine