Exploring Nutritional Data Using K-means Clustering
Nutritional data is a useful playground for unsupervised learning - dozens of nutrient dimensions, no obvious labels, and a real question worth answering: what natural groupings emerge when you let the math sort foods rather than the food pyramid?

Part of the Python and Data Science for .NET Developers series
Phase Modeling, Part 6
Data Science Series — 6 articles
- When the First Visualization Answers the Wrong Question
- Data Science for .NET Developers
- Python: The Language of Data Science
- Exploring Nutritional Data Using K-means Clustering
- Exploratory Data Analysis with Python
- Learning Python in the Post-Copilot World
Filed under Pragmatic architecture and modernization
Topic cluster
Python and Data SciencePython, data analysis, visualization, and machine learning foundations from a .NET developer's perspective.
Why This Dataset Needed Clustering
Nutritional datasets are full of variables but light on labels. After finishing the companion analysis, Exploratory Data Analysis with Python, I had clean features and distributions, but not a clear way to answer a practical question: which foods are naturally similar when you compare nutrient profiles directly?
That is where K-means became useful. Not because it is mathematically elegant, but because it forced a concrete decision: are these groupings stable enough to support real interpretation, or are they just artifacts of scaling and feature choice?
The First Clusters Were Easy to Produce
For this dataset, K-means worked best as an exploratory lens. The model highlighted centroid-level patterns I could inspect quickly, but only after careful normalization. Without scaling, calorie-heavy features dominated distance calculations and the clusters were less interpretable.
I also treated K as a decision, not a default. I compared elbow and silhouette behavior across multiple candidate values, then inspected the centroid profiles. The smallest K with a respectable score was not automatically the best choice; the groups also had to describe differences I could explain without inventing a story after the fact.
The turning point was realizing that a "good" score was not enough. A few early runs looked acceptable numerically, but the centroid summaries grouped nutritionally dissimilar foods together. That was the moment this stopped being a modeling exercise and became an interpretation exercise.
Applying PCA Before and After Clustering
PCA helped in two places: reducing noise before clustering experiments and visualizing cluster separation afterward. It did not replace K-means, but it made cluster behavior easier to inspect and challenge.
from sklearn.preprocessing import StandardScaler
from sklearn.decomposition import PCA
from sklearn.cluster import KMeans

X_scaled = StandardScaler().fit_transform(X)
X_pca = PCA(n_components=2, random_state=42).fit_transform(X_scaled)
labels = KMeans(n_clusters=4, random_state=42, n_init=20).fit_predict(X_scaled)
That workflow gave me a useful check: if points looked separable in PCA space but centroid summaries were nutritionally incoherent, the clustering setup needed to be revisited.
What the Clusters Could Support
- Decision support for meal planning: The clearest clusters grouped foods by nutrient density patterns that are practical for planning, such as protein-forward vs. carbohydrate-heavy mixes.
- Product and portfolio analysis: Cluster summaries provided a compact way to compare groups of foods instead of scanning dozens of raw columns.
- Research direction, not final truth: The model surfaced hypotheses worth testing, especially where boundary foods sat between clusters.
What changed for me from the EDA phase was confidence in where to look next. EDA answered "what is in this dataset?" Clustering answered "which parts deserve follow-up analysis first?"
Limits That Matter
K-means assumes roughly spherical clusters and reacts to initialization and scaling choices. In nutritional data, that matters because many foods sit on gradients rather than in neat buckets. The most useful mindset here was not "the model found the answer," but "the model exposed structure I can now test with domain context."
From a Chart to a Defensible Result
This project moved from data hygiene to pattern discovery, and that transition was the real value. K-means and PCA helped reveal structure, but interpretation improved only when I treated cluster outputs as starting points for judgment, not automated decisions.
The unresolved question is whether domain-informed features would make the boundary foods more stable than further tuning K. That is the difference between an interesting chart and a decision-support tool: not whether the clusters look clean, but whether they remain useful when the ambiguous cases receive more scrutiny.
Further Reading
Explore More
- When the First Visualization Answers the Wrong Question -- Why choosing a chart is part of the analysis
- Data Science for .NET Developers -- Why .NET Developers Should Consider Data Science
- Python: The Language of Data Science -- Understanding Python's Impact on Data Science
- Exploratory Data Analysis with Python -- Master the art of data exploration and visualization with Python's power
- Understanding Neural Networks -- A Beginner's Guide to Neural Networks
Related project evidence
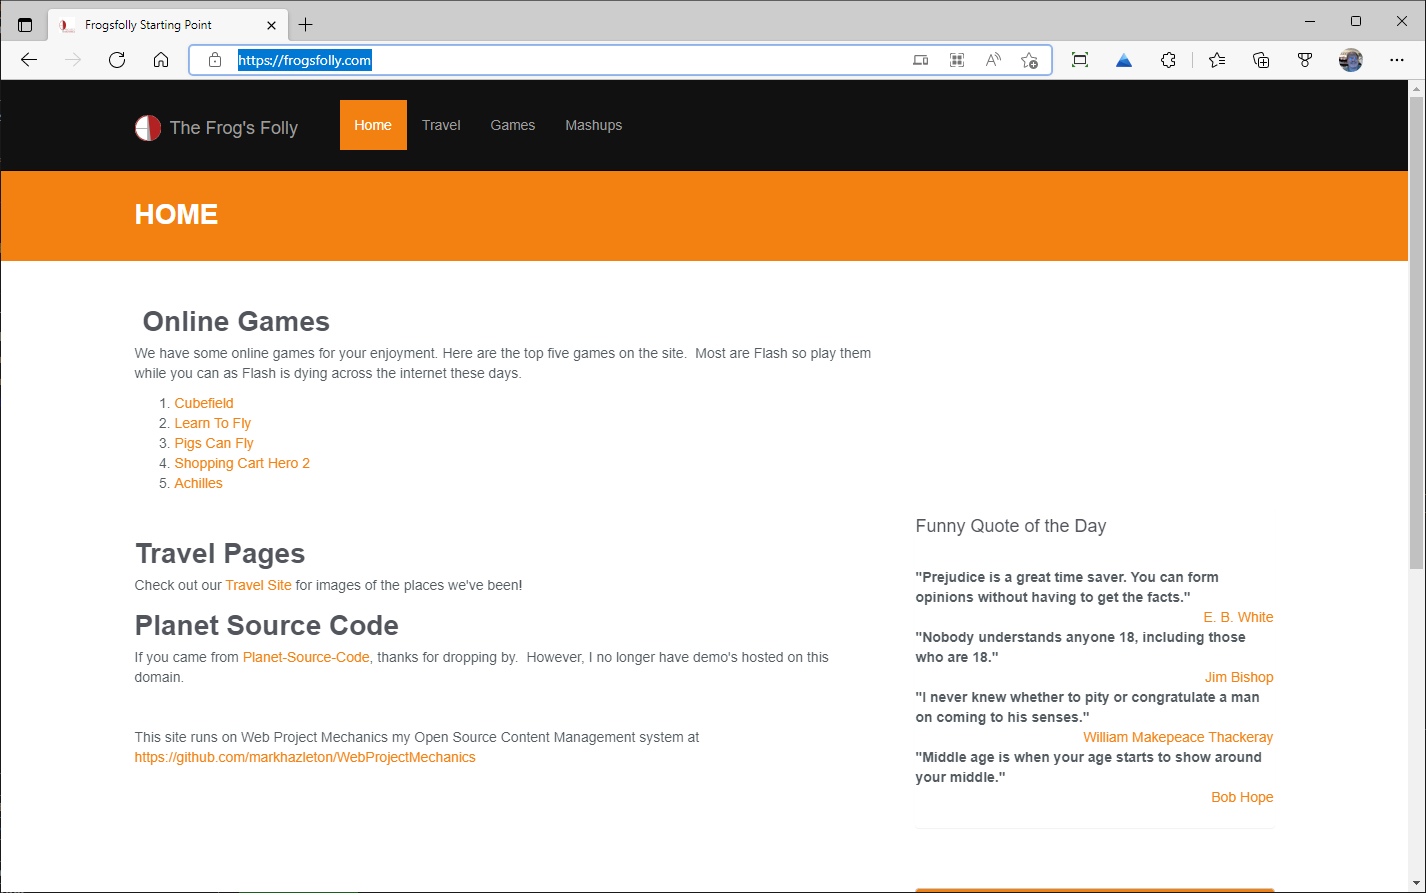
Frogsfolly.com Main
Frogsfolly.com is the original website I created in 1999 when learning web technologies.
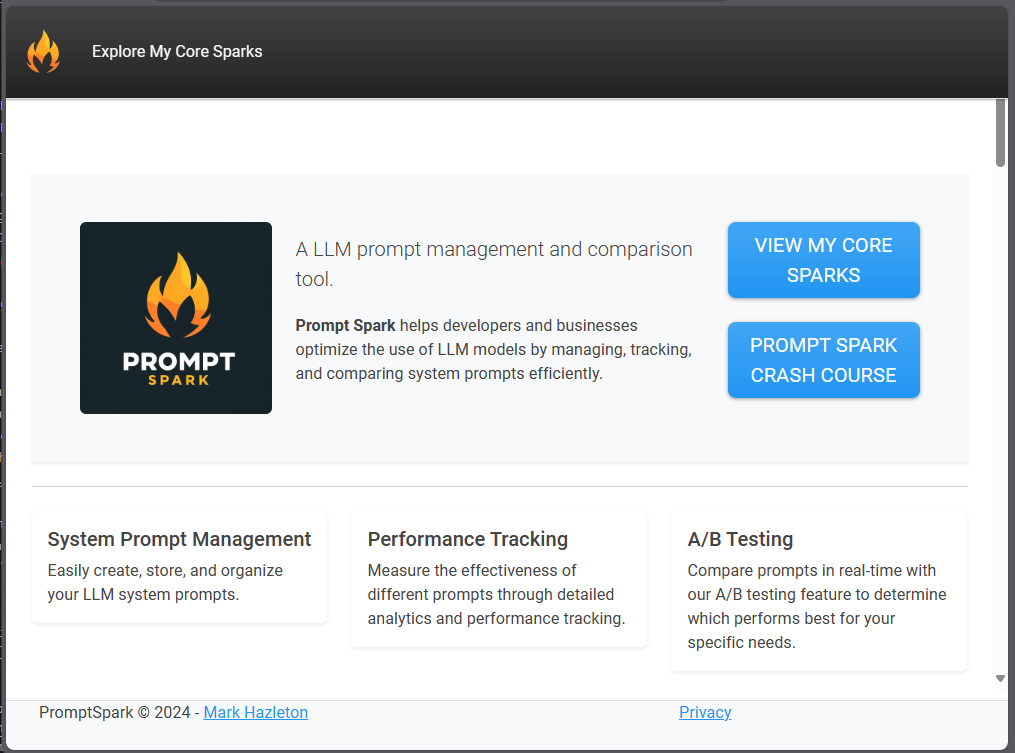
PromptSpark
PromptSpark.Chat is a real-time, workflow-driven chat application built with ASP.NET Core, SignalR, and Adaptive Cards. Users interact with branching multi-step workflows through conversational UI, with optional AI-driven responses via IChatCompletionService.
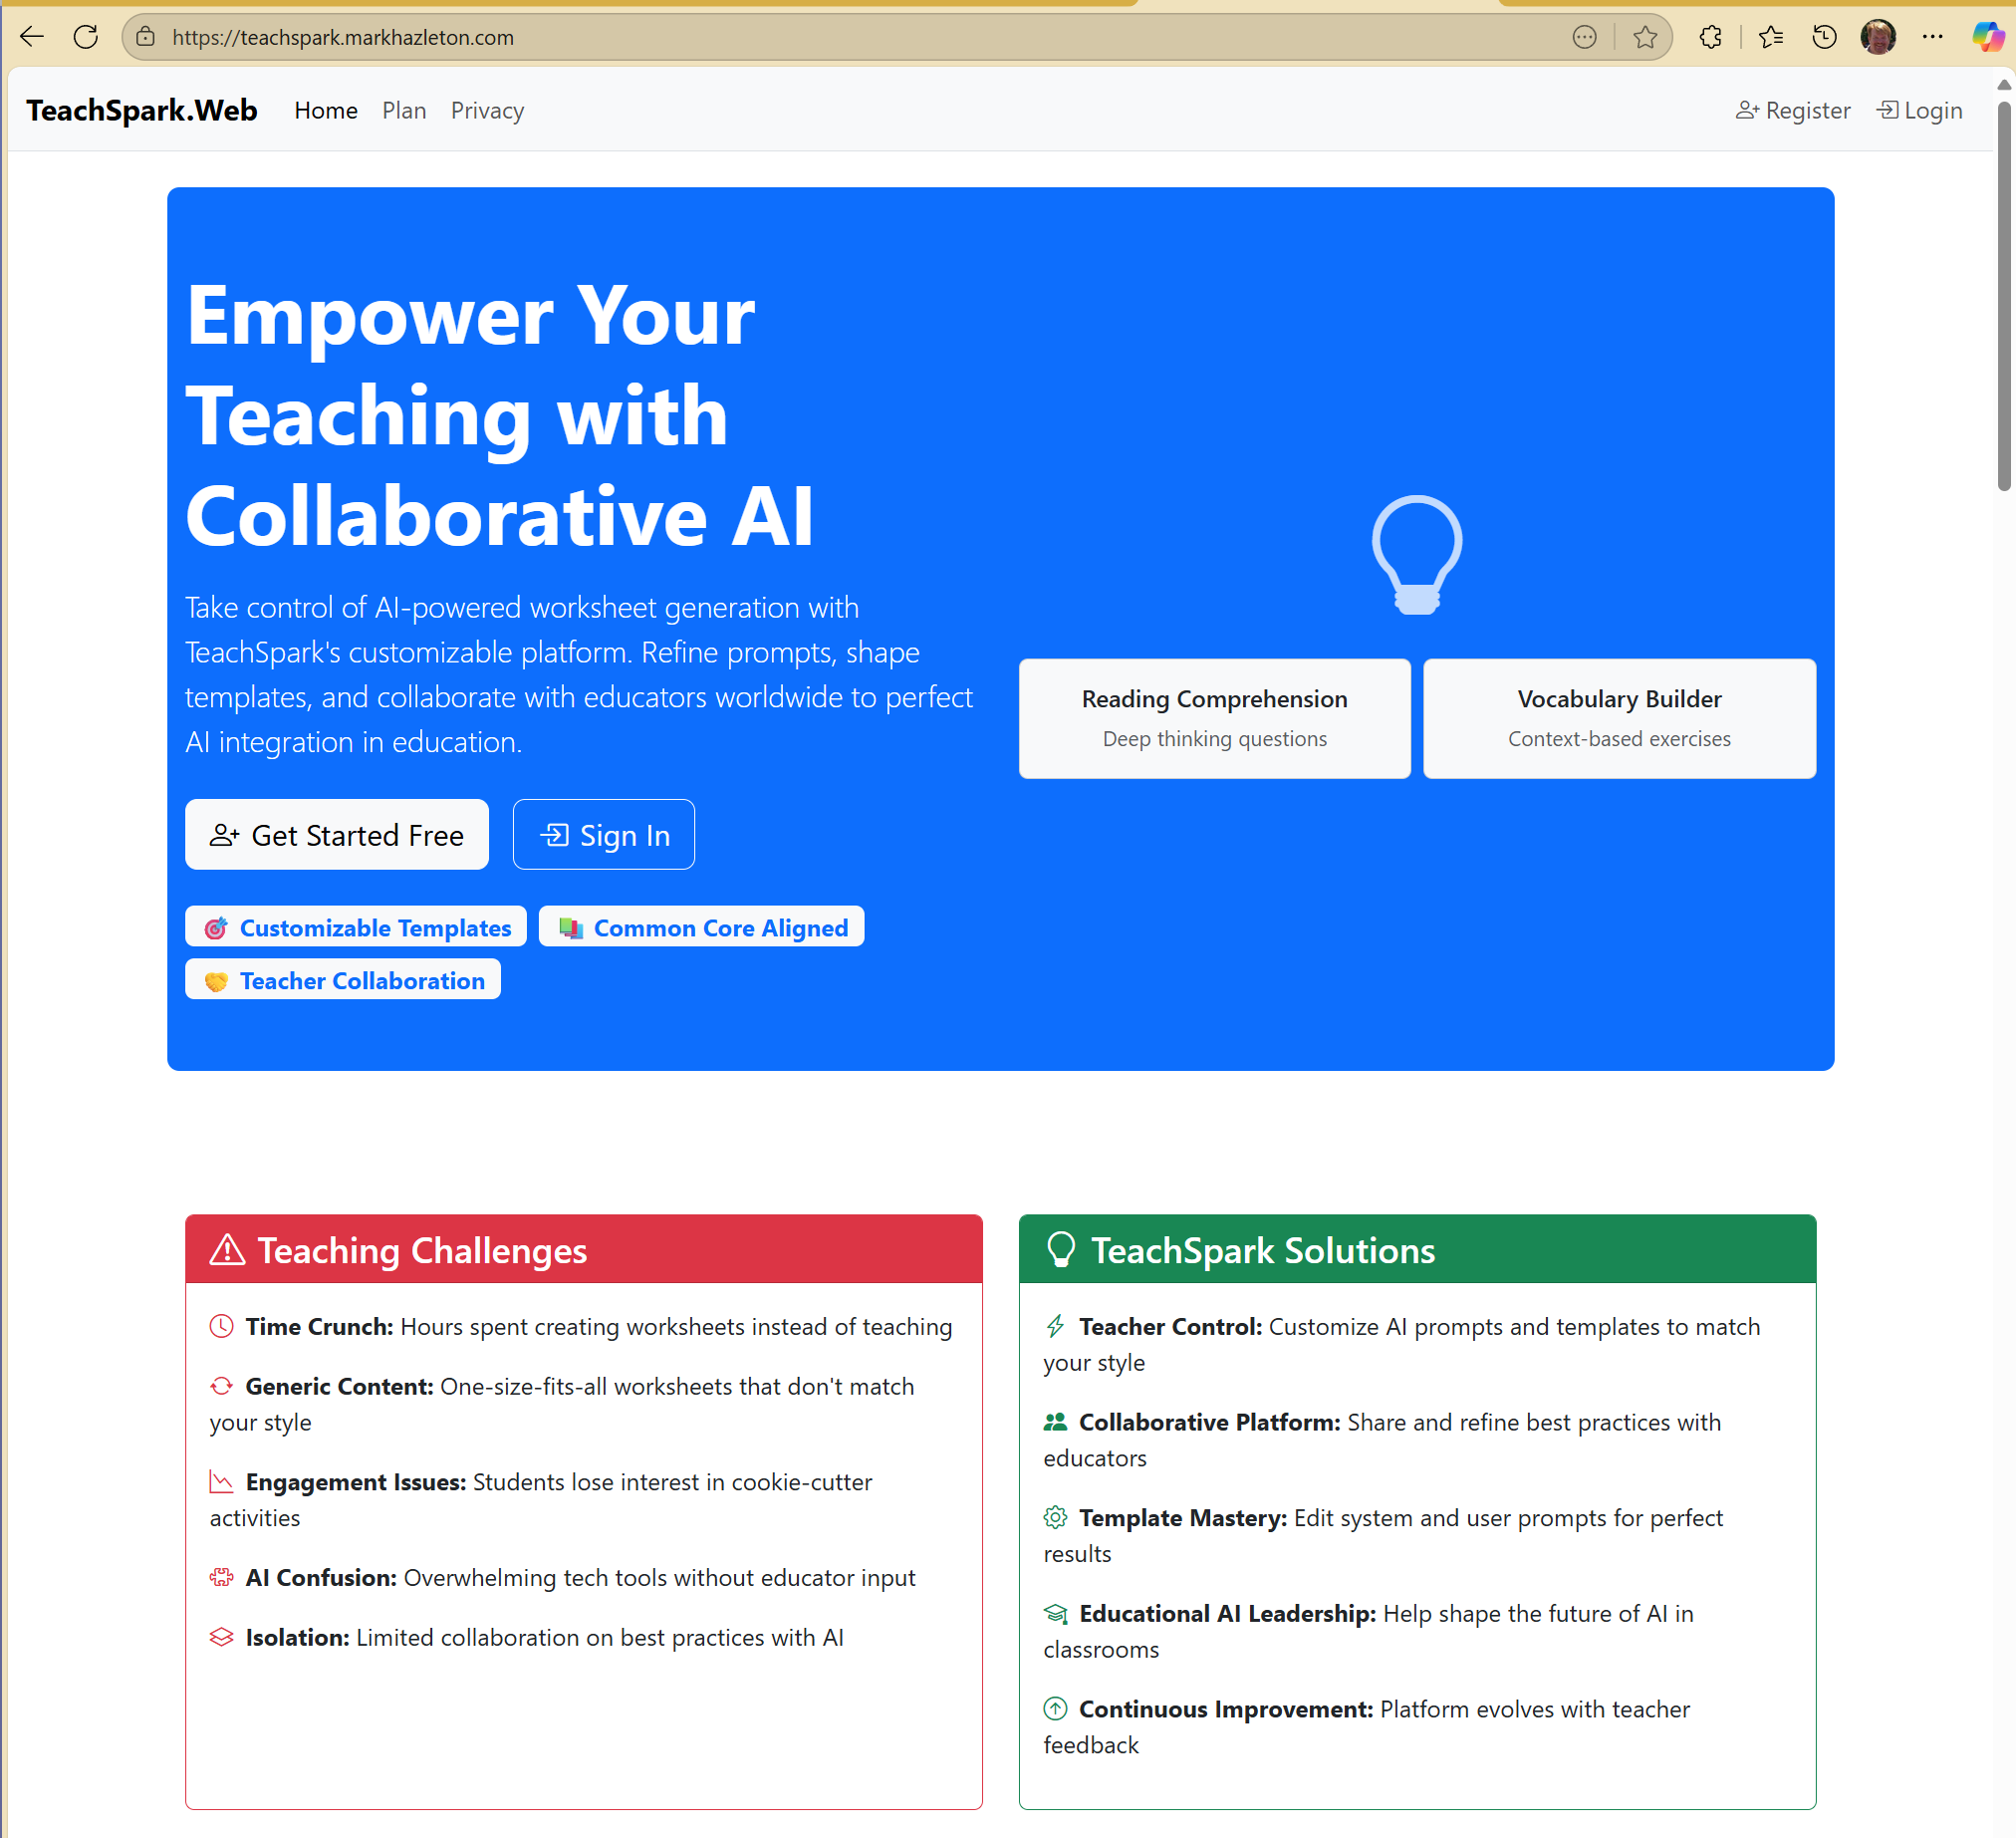
TeachSpark: AI-Driven Educational Platform
TeachSpark is an LLM-powered educational platform built with .NET 10 MVC and a Webpack 5 frontend build system. It provides adaptive learning with personalized content delivery, interactive curriculum with real-time feedback, progress analytics, and comprehensive code quality tooling (ESLint, Prettier, Husky).
Working through something similar?
If this maps to something you're working on, I'm glad to compare notes. Start with the system and the constraint that matters most.