RESTRunner: Building a DIY API Load Testing Tool
A technical retrospective on RESTRunner — built when three strict criteria demanded it. Covers the concurrency and telemetry decisions that shaped it, the mistakes embedded in its history, and a framework for knowing when your team should build its own tools.
Software Engineering Series — 3 articles
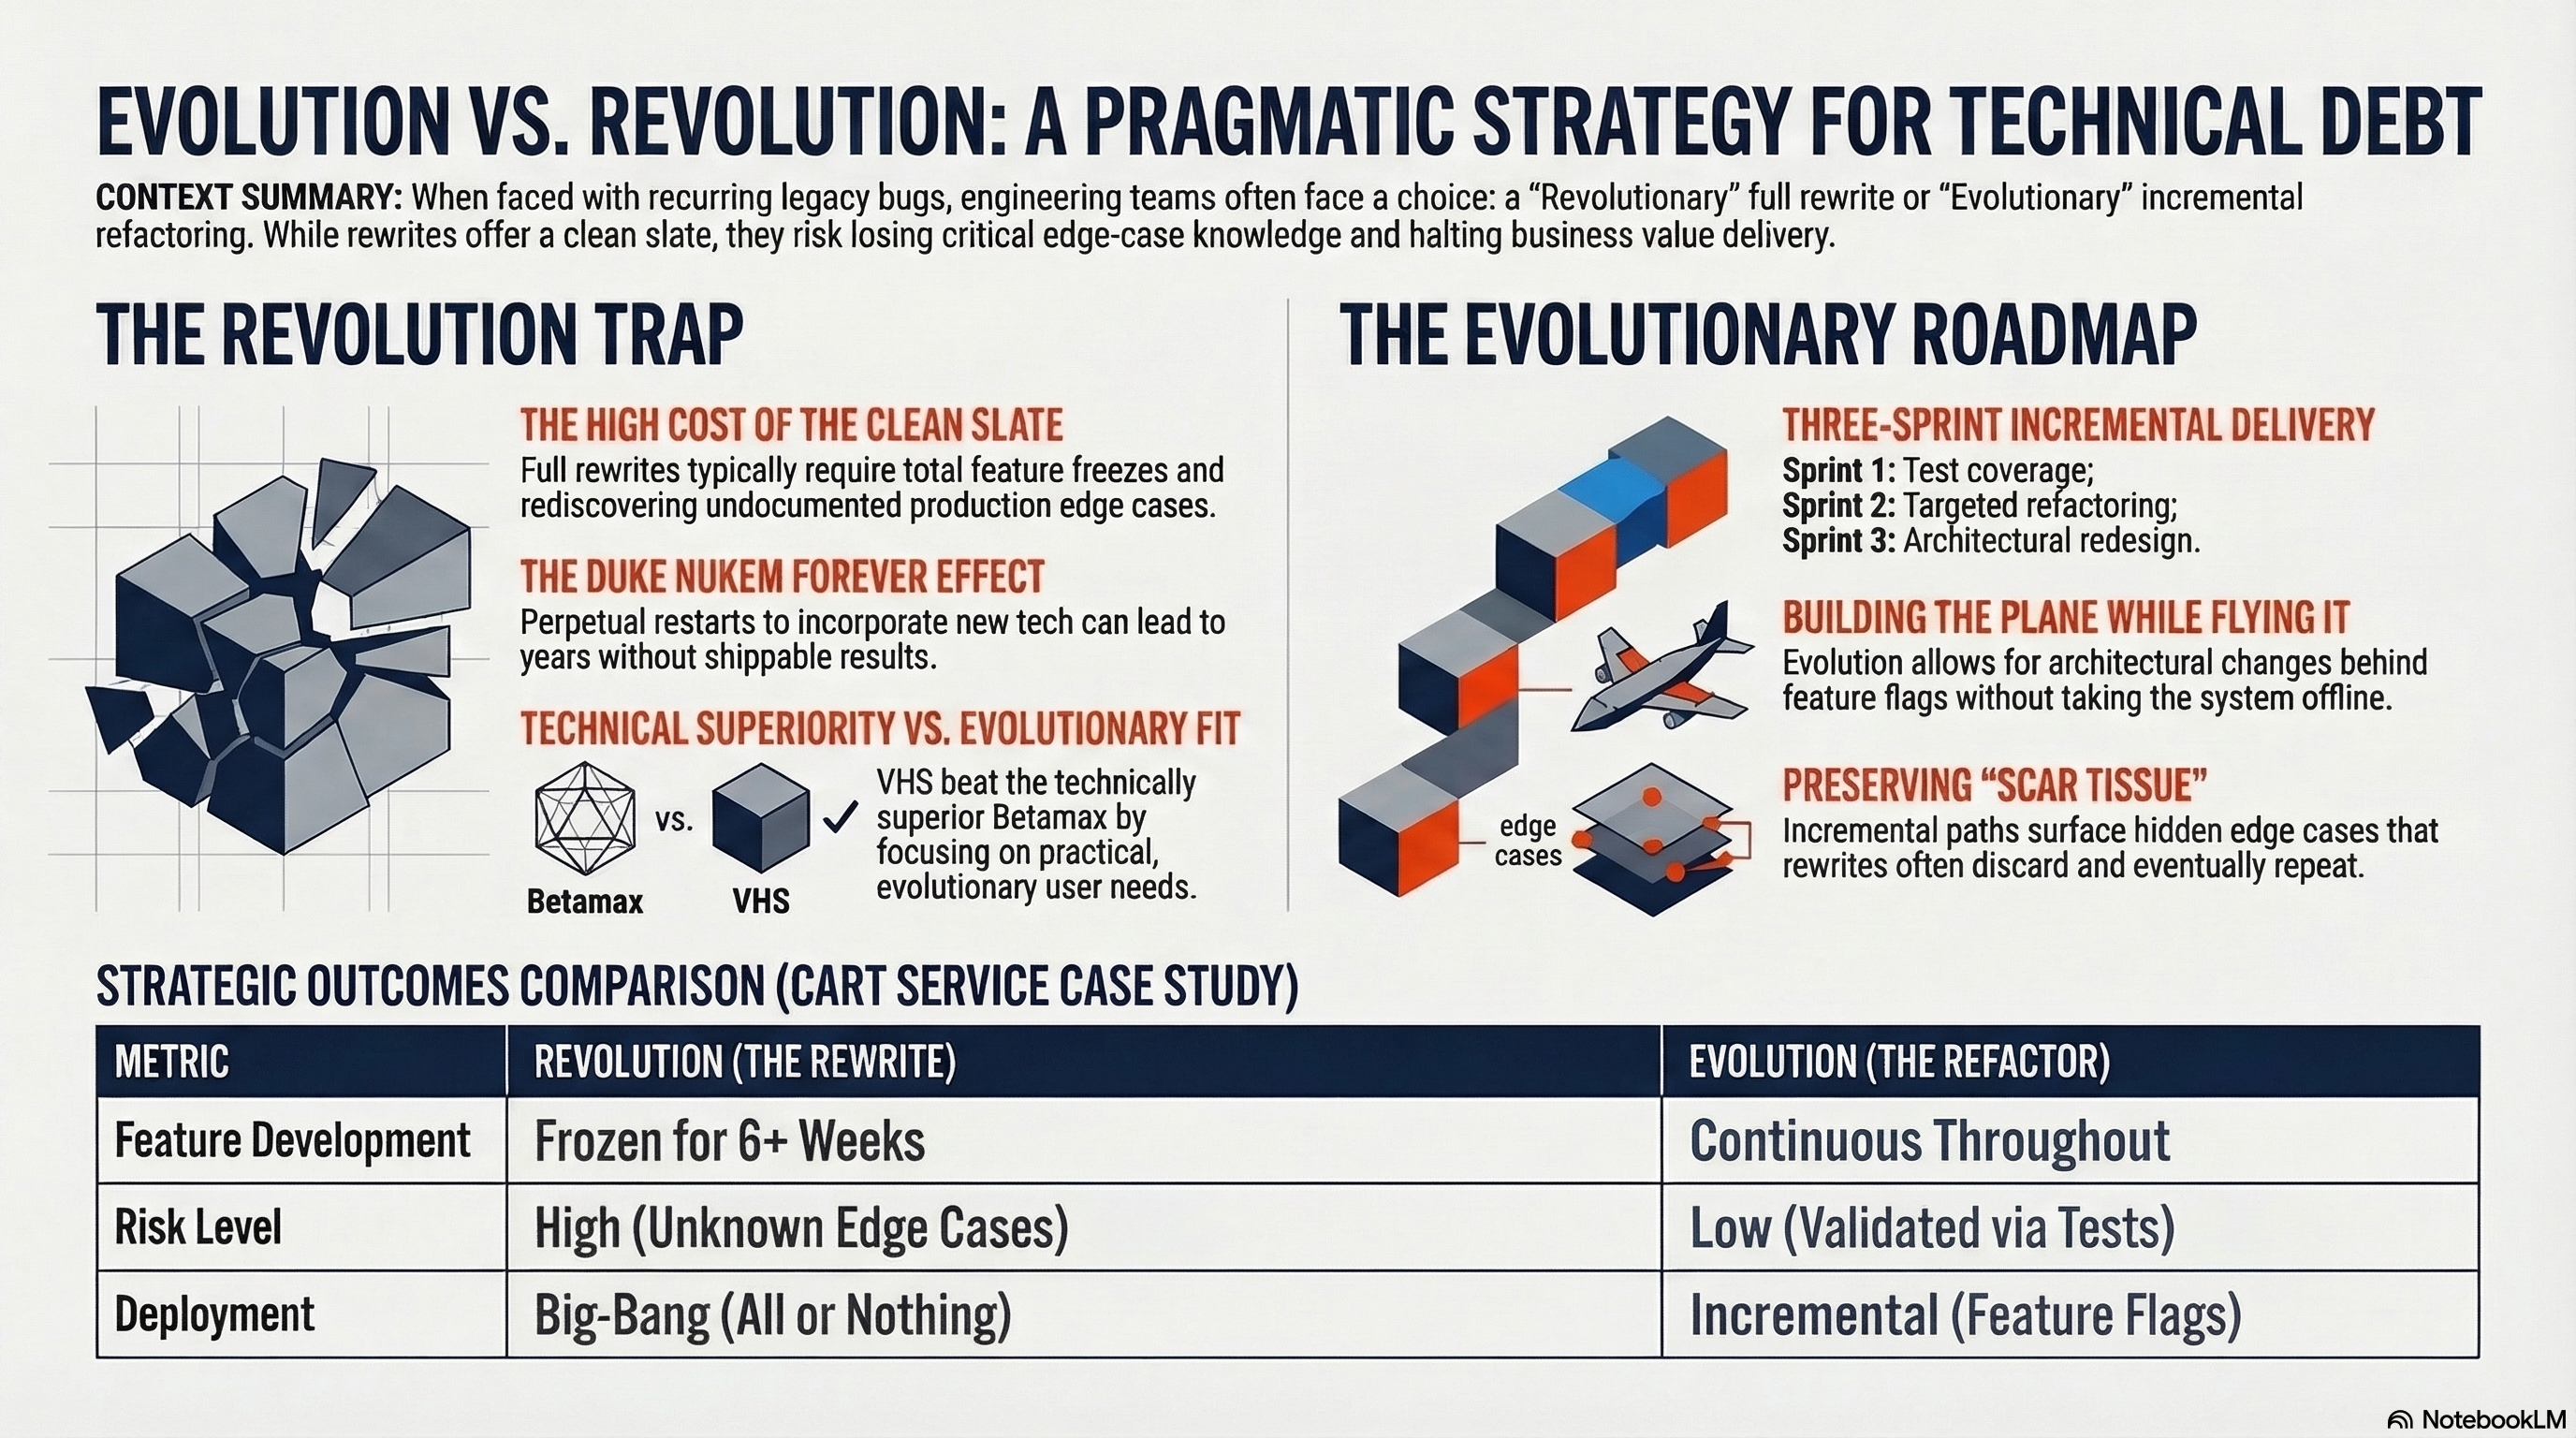
- Evolution over Revolution: A Pragmatic Approach
- RESTRunner: Building a DIY API Load Testing Tool
- Stop Digging Through Logs. Start Designing for Learning.
The Decision Nobody Agrees On
Conventional wisdom is clear: don't build your own load testing tool. JMeter exists. K6 exists. Locust exists. They are mature, battle-tested, and maintained by teams whose entire job is load testing infrastructure. The argument for building your own usually begins with "it would only take a few hours" — and that is the moment experienced engineers quietly leave the room.
So before anything else, here are three strict criteria for when building your own is genuinely the right call:
1. Build when existing tools force you to maintain duplicate API representations. If adopting a third-party load tester means manually re-entering endpoint routes, payloads, and headers every time the API changes, you are paying a maintenance tax on every API change for the lifetime of the tool.
2. Build when zero-dependency portability is a hard constraint. If your environment is air-gapped, CI/CD-governed in ways that make external dependencies bureaucratic obstacles, or hostile to tools with database or cloud service requirements, a compiled executable reading local files has a decisive operational advantage.
3. Build when staying in your existing stack is itself the constraint. If your team is a .NET shop and introducing a Java, Go, or Python runtime creates real maintenance overhead, "we already know how to do this in C#" is a legitimate engineering criterion — not an excuse.
I hit all three. This is the four-year story of what happened next — and what it proved.
The first commit to RESTRunner is dated September 30, 2021. The tool is still in active development today. This is the retrospective I wish I'd had before I started.
Evaluating the Alternatives
Before that first commit, I looked hard at what already existed. The constraint was straightforward: we were building in .NET and wanted to stay there. Every tool I examined either failed one of the three heuristics or failed all of them.
Postman: Close, But Built for Something Else
Postman is excellent, and I was already using it. I had full collections built for the API — endpoints, headers, auth tokens, environment variables. The natural first move was to run those collections under the built-in runner.
It works for sanity checks. But the gap between functional testing and load testing became apparent quickly:
- Statistics model: Postman reports response time per request. It does not compute P90, P99, or any percentile aggregate across a run. For functional testing, you care whether each request succeeded. For load testing, you care about the shape of the distribution.
- Multi-environment concurrency: Running the same endpoint against dev and staging simultaneously requires separate collection runs. There is no built-in construct for "run this test matrix across N instances and aggregate the results."
- Tier limits: The free tier limits monitor frequency and iteration count. Working around these constraints via Newman (the CLI runner) pushed me into writing shell scripts around it — at which point I was building a tool around Postman rather than using Postman itself.
Postman is a .NET-friendly tool, but it is designed for functional API testing. What I needed was a load runner, and bending Newman into that shape kept producing more glue code than test results. This was Heuristic #1 in embryonic form: every workaround generated a new duplicate representation to maintain.
JMeter, K6, and Locust: Outside the Stack
JMeter runs on Java. K6 runs on a JavaScript/Go engine. Locust runs on Python. All three are capable, well-maintained tools. None of them are .NET.
Introducing any of them to a .NET shop meant adding a new runtime, a new package ecosystem, and a new configuration model to a team that already had a perfectly capable platform for making HTTP calls. For a project whose sole purpose was to test a .NET API, that tradeoff never made sense. We didn't want to learn and maintain a foreign toolchain; we wanted to fire HTTP requests at our own service and read the numbers.
There are genuine technical benefits to staying in .NET for this kind of work — and they became clear over time. When your test client uses the same HttpClient and IHttpClientFactory patterns as your production services, you get connection pool semantics that match what real clients experience. When .NET ships a new runtime version, your test tooling gets faster too: upgrading RESTRunner to .NET 10 delivered 25% faster test execution and 19% faster builds with zero code changes, a dividend that only flows when you own the runtime.
The Batch File Era
Before that first commit, there was a folder full of .bat and .ps1 files using curl in a loop.
@echo off
FOR /L %%i IN (1,1,100) DO (
    curl -s -o NUL -w "%%{http_code} %%{time_total}\n" ^
         -H "Authorization: Bearer %TOKEN%" ^
         https://api.example.com/endpoint
)
This works in the same way duct tape works. Every request fires serially — which does not model real-world traffic. The output is a wall of text with no context. Getting anything meaningful out requires piping through awk or another PowerShell script, and now there are three files to maintain instead of one.
But the deeper problem wasn't the technology. It was the absence of a domain model. Everything was stringly typed: URLs, headers, auth tokens, expected response shapes — all raw strings threaded through a chain of scripts. Without explicit types like CompareRunner and CompareRequest, the compiler couldn't catch anything. If a teammate misspelled a JSON key, or if an API response changed shape, nothing would surface it at compile time. The failure would arrive as a cryptic runtime exception in the middle of a test run, usually at the worst possible moment.
I would spend the next two years refactoring toward the domain model that should have existed on day one. Defining a clear domain model — the types, the interfaces, the contracts between "configure a test" and "execute a test" — should have been the very first commit. Not the batch scripts, not the prototype runner. The domain model first, everything else on top of it.
This is the phase every developer goes through before admitting the problem deserves a real solution. The batch file era ended on September 30, 2021: initial commit.
Section A: Mastering Concurrency and Socket Health
The most important engineering arc in RESTRunner's early history is about connection lifecycle — getting from "fires HTTP requests in a loop" to "correctly manages a concurrent connection pool under load." Three decisions drove this arc, and they are causally linked.
Dropping RestSharp: Fewer Abstractions, More Visibility
RestSharp appeared in the first weeks as a convenience dependency. It simplified request construction and is a perfectly capable library. But it introduced an abstraction layer between the test runner and the HTTP connection underneath. When performance problems appeared later, that abstraction made diagnosis harder — there was one more layer to reason through before reaching the socket.
In January 2022, RestSharp was removed. Native HttpClient only. This was not ideology. It was a visibility decision: if the tool is measuring HTTP response times, it should own its HTTP stack entirely.
The Socket Exhaustion Discovery
Removing RestSharp exposed a raw HttpClient instantiation pattern that had been hidden underneath it:
// The antipattern that causes socket exhaustion under load
using var client = new HttpClient();
var response = await client.GetAsync(url);
This looks harmless. It is not. When HttpClient is disposed, the underlying TCP connection enters TIME_WAIT state — a TCP protocol requirement that prevents late-arriving packets from being misdelivered to a new connection. The OS holds the socket in this state for up to four minutes after it closes. Under any significant load, sockets are exhausted faster than TIME_WAIT expires, and requests begin failing with SocketException.
For a load testing tool firing 1,000 requests per second, exhausting the 65,000 available ephemeral ports takes roughly a minute. Then the application suffocates — not because the API under test failed, but because the test runner itself ran out of connections.
This is one of the most common and least intuitive bugs in .NET HTTP code. It does not surface during functional testing, because functional tests make a small number of requests. It surfaces during load testing — exactly when you cannot afford it. The desire for higher throughput uncovered the bottleneck, which demanded an architectural solution.
IHttpClientFactory: The Correct Fix
The IHttpClientFactory pattern, introduced in March 2023, solves socket exhaustion at the framework level. Rather than creating a new HttpMessageHandler — and therefore a new TCP connection — for each HttpClient instance, the factory maintains a pool of handlers and recycles them according to a configurable lifetime (default: two minutes). Connections stay warm. Sockets are not exhausted.
// IHttpClientFactory manages connection pooling at the handler level
services.AddHttpClient<ExecuteRunnerService>();
The ExecuteRunnerService receives an HttpClient from the factory via constructor injection. The factory manages the HttpMessageHandler pool transparently. This is the correct architecture for any .NET service making high-volume outbound HTTP calls.
This is also Heuristic #3 made concrete — in a way that only becomes visible when you stay in the stack. A load tester written in Python or Java would have abstracted this socket lifecycle away entirely, hiding the antipattern from view. The socket exhaustion bug might have stayed lurking in the production codebase, invisible until a traffic spike. Staying in .NET meant the test tooling and the application shared the same runtime, the same libraries, and the same failure modes — and a production antipattern was exposed through the act of building the test tool itself.
SemaphoreSlim: The Right Primitive for I/O-Bound Concurrency
The concurrency control in RESTRunner is SemaphoreSlim, defaulting to 10 parallel slots. This choice has a specific justification, because simpler alternatives exist.
Parallel.ForEach partitions work across CPU cores. It is designed for CPU-bound computation, not for dispatching I/O-bound HTTP requests where the bottleneck is network latency, not processor cycles. Using it here would create thread-pool pressure disproportionate to the actual work.
Task.WhenAll with manual partitioning works, but requires pre-allocating fixed-size batches that do not adapt to variable request completion times. If one batch of ten requests has one slow outlier, the next batch waits for it — reducing actual concurrency at exactly the moments when some slots are available.
SemaphoreSlim is appropriate here for three reasons:
async/awaitcompatibility:SemaphoreSlim.WaitAsync()is a true awaitable — it does not block a thread while waiting for a slot. Threads are released back to the pool while requests are in-flight, which is essential for I/O-bound work.- Runtime-configurable concurrency: The slot count is a configuration value, not a compiled partition size. Dial concurrency up or down without rebuilding.
- Correct model for load testing: HTTP requests wait on the network.
SemaphoreSlimgates how many can be simultaneously in-flight without introducing artificial thread-pool contention.
// SemaphoreSlim gates concurrent in-flight requests without blocking threads
var semaphore = new SemaphoreSlim(maxConcurrency);

var tasks = requests.Select(async request =>
{
    await semaphore.WaitAsync();
    try
    {
        return await ExecuteRequestAsync(request);
    }
    finally
    {
        semaphore.Release();
    }
});

await Task.WhenAll(tasks);
Section B: Capturing What Actually Matters (Telemetry)
Getting concurrency right solved the "does it work under load" problem. Getting telemetry right solved the "does it work well under load" problem. These are different problems, and the wrong measurement instrument gives you false confidence.
Why Averages Lie
Consider a test run with 1,000 requests: 990 complete in 10ms, and 10 complete in 8,000ms. The average response time is approximately 80ms. That number passes any reasonable performance acceptance threshold. But 1% of your users are waiting 8 seconds, and your dashboard says everything is fine.
This is not a hypothetical. It is the standard failure mode of average-based performance monitoring. Production incidents caused by tail latency regularly survive average-based alerting because the degradation is concentrated in a small percentile that the mean washes out. P99 at 8,000ms is immediately actionable. Average at 80ms is noise.
Building ExecutionStatistics: Thread-Safe Percentile Collection
The ExecutionStatistics class was introduced in early 2023 as a thread-safe container for response time data collected across concurrent requests. As requests complete from multiple threads simultaneously, each timing result is appended to a ConcurrentBag<long> — a lock-free concurrent collection suited to the accumulate-then-read access pattern of a load test.
When all requests finish, the collection is sorted and percentiles are read directly from the sorted array: the value at index (int)(count * 0.50) is P50, at (int)(count * 0.99) is P99, and so on. No approximation, no reservoir sampling — the full result set is in memory and exact percentiles are trivially cheap to compute at completion.
P50:   82ms   ← what most users experience
P75:  110ms
P90:  145ms   ← a natural SLA reference point
P95:  220ms
P99:  891ms   ← the tail that hurts in production
P99.9: 4,200ms ← the outliers that generate support tickets
These statistics are broken down by HTTP method, status code, target instance, and test user. That means you can answer questions like "is the P99 worse on staging than dev?" or "is one user context consistently slower than another?" Averages cannot answer these questions. Percentiles segmented by dimension can.
Response Hashing: The Smoking Gun
Timing metrics tell you how fast a car is moving. Response hashing tells you whether the bridge it's crossing is structurally sound.
Most load testing tools measure one thing: HTTP status code and latency. Fire 1,000 requests, receive 1,000 HTTP 200 OK responses at 42-millisecond average latency, paint a green checkmark on the dashboard. The load test is a success. Ship it.
But HTTP 200 OK tells you the server responded. It says nothing about whether the response contained correct, current data — or whether every server instance in the cluster was returning the same data.
Here is exactly what happened during one of RESTRunner's test runs. Two instances of the same .NET API were under test simultaneously. A generic tool like JMeter would have observed:
- 1,000 requests sent across both instances
- 1,000 HTTP 200 OK responses received
- Average latency: 42ms, P99: 98ms
- Conclusion: Green. Deploy.
RESTRunner saw the same status codes and latency numbers — and also flagged hash divergence between the two instances. The response bodies did not match. One instance had a cache entry that had been invalidated on the other. Instance B was serving data from three hours ago.
If the team had deployed based on the generic tool's green light, they would have served stale, incorrect data to production users — all while the dashboards looked perfectly healthy. There would have been no alert, no obvious signal, no moment of failure to debug. Just users silently receiving wrong data.
This is not a "neat feature." It is the philosophical climax of the entire four-year project. This single discovery — invisible to every HTTP status code and latency metric in existence — validates every architectural decision that preceded it: the domain model that understood the response structure, the native stack that made semantic normalization tractable, the percentile telemetry that proved the system was fast. Fast and wrong, as it turned out.
A generic external tool is, by design, domain-agnostic. It cannot know which fields in your response are timestamps or correlation IDs to be stripped before hashing. It cannot know what "semantically identical" means for your API. Building a domain-specific tool — in the same stack, by the team that knows the API — is what makes that knowledge programmable.
The mechanism: compute a deterministic SHA-256 hash of each normalized response body. Normalization is essential — production API responses typically include non-deterministic fields (timestamps, request correlation IDs, server hostnames in headers) that would produce different hashes for functionally identical responses. Before hashing, a configurable set of JSON property paths is stripped from the body. Without this step, every response appears unique and the feature generates only false positives.
Strip the noise. Hash the signal. Compare across instances. Catch what status codes miss. This is Heuristic #3 at its highest resolution: staying in the stack gave the tool enough proximity to the domain to detect a catastrophic correctness failure before it reached production.
Section C: Ecosystem Integration (Reducing Friction)
Technical correctness earns the tool a place in the workflow. Ecosystem integration determines whether it stays there.
The Postman Import: One Source of Truth
Four days after the initial commit — October 4, 2021 — Postman collection import was working. This was not an afterthought. It was a first-principle decision about where the definition of "what to test" should live.
The alternative is duplicate representation: your API definition lives in Postman (or an OpenAPI spec), and your load test configuration duplicates it in a tool-specific format. Every time an endpoint route changes, a header is added, or an auth parameter shifts, both representations require updates. That synchronization gap is where incorrect test configurations hide.
The RESTRunner.PostmanImport project parses Postman Collection v2.1 JSON and converts it directly into CompareRequest objects. When an endpoint is added to or changed in the Postman collection, it appears in the load test on next import — no manual re-entry.
// The Postman collection is the source of truth for what to test
var collection = PostmanImport.LoadCollection("collection.json");
var requests = collection.GetRequests();
The Postman collection becomes the canonical API definition that RESTRunner consumes rather than duplicates. This is Heuristic #1 delivered: one representation, one maintenance surface.
There was a second friction problem that the Postman import didn't solve — and that I underestimated for years. Onboarding a teammate meant walking them through JSON config files, CSV output, and a terminal window. Every time I tried to hand off the tool, I watched the cognitive overhead suppress adoption. Colleagues would run it once with my help, then stop. The tool was useful to the person who built it. It was not useful to a team.
The right answer was obvious in retrospect. But I deferred it repeatedly because "it works for me."
Zero-Database, File-Based Portability
All storage in RESTRunner is file-based. Configs, collections, OpenAPI specs, and execution results live in a Data/ folder. There is no database, no external service dependency, no migration script.
This is a deliberate architectural trade-off. A database-backed model would enable multi-user collaboration and team-scale history management at the cost of a provisioned database. In practice, many of the environments where a load testing tool is most needed are the ones where adding a new external dependency is hardest: air-gapped networks, restricted CI/CD pipelines, environments where every new service requires a change ticket and a security review.
A compiled .NET executable that reads and writes local JSON files deploys as a single build artifact and runs anywhere the .NET runtime is present. That operational simplicity is worth the scalability trade-off for the use cases this tool is designed for — and the domain model is architecturally clean enough that swapping the storage layer later is a bounded problem. This ceiling is real, though, and worth communicating explicitly to any team evaluating the tool: file-based storage means no shared history, no concurrent configuration editing, no audit trail. Evaluate that constraint before adopting.
The Web UI and Real-Time Progress
In September 2025 — four years into the project — the console application was joined by an ASP.NET Core MVC web application. The motivation was the adoption problem described above: a browser interface is not a luxury feature. It is the difference between a tool you use and a tool your team uses.
This should have been the second milestone, not the fourth-year addition. A web UI is adoption infrastructure. Building it late means four years of a team not using the tool, not filing bug reports, not contributing configurations. The deferred cost compounds every sprint.
The web application added:
- SignalR for real-time progress — live progress during a 100-iteration test run is meaningfully better than a cursor and a count
- Configuration management — named, saveable test configurations via the browser
- Postman collection upload — drag-and-drop import, no file system access required
- Interactive results — a filterable data table by status code, HTTP verb, instance, and user, with CSV export retained
- Execution history — every run is persisted and browsable across sessions
The web UI also unlocked a self-testing pattern: a SampleCRUDService proxies through to a live sample API and re-exposes those endpoints as Minimal API routes inside the web application. Out of the box, RESTRunner has something to test against — no external dependency required to demonstrate or exercise the tool.
What RESTRunner Looks Like Today
The solution contains six projects, and the dependency architecture is intentional, not accidental.
RESTRunner.Domain has no infrastructure dependencies. It contains the models (CompareRunner, CompareRequest, CompareInstance, CompareResult), the interfaces, and the ExecutionStatistics collection class. It can be tested, reasoned about, and evolved independently of any HTTP library or storage mechanism.
RESTRunner.Services.HttpClient depends on Domain only. It contains the execution engine: the IHttpClientFactory integration, the SemaphoreSlim concurrency gate, and the request dispatch loop. Swapping the HTTP implementation — adding custom middleware, injecting a mock transport for testing — requires changes to this project only.
RESTRunner.PostmanImport is isolated from the execution engine entirely. It knows about Postman's JSON format and the Domain models, and nothing else. This isolation was deliberate: the parser is a candidate for NuGet packaging and independent reuse, and it could be replaced with an OpenAPI import pipeline without touching anything in the execution path.
RESTRunner.Domain.Tests covers the Domain layer with 21 MSTest unit tests, all passing. Unit tests belong here because the Domain layer has no infrastructure dependencies and no async I/O — it is the right layer to test exhaustively and cheaply.
RESTRunner (console) and RESTRunner.Web (ASP.NET Core MVC) are entry points that wire up the dependency injection container and surface the execution pipeline — one as a command-line artifact, one as an HTTP application.
The dependency graph flows strictly downward: Web and Console → Services.HttpClient → Domain. PostmanImport → Domain. Nothing flows upward. The core logic is independently testable; the entry points are thin; the components are independently replaceable. This is the architecture that three years of refactoring converged on, and it would have been cheaper to start here.
At its operational core, RESTRunner executes a matrix:
Environments × Endpoints × Users × IterationsTwo environments, four endpoints, two test users, 100 iterations: 1,600 individually tracked requests, aggregated across every dimension you care about.
The web application handles most use today. Key capabilities: named test configurations, Postman collection import, OpenAPI endpoint browsing, real-time test execution via SignalR, execution history, and P50/P75/P90/P95/P99/P99.9 statistics broken down by method, instance, user, and status code. All of it running on local files, with no database.
OpenAPI Integration: Current Boundary and Next Milestone
The current OpenAPI feature set loads a Swagger/OpenAPI specification, lets you browse declared endpoints, and executes individual requests with Bearer token, API key, and Basic auth support. This is useful for API exploration and manual spot-testing against a live spec.
The planned next milestone is a defined, scoped piece of work: parse the spec's operation definitions, request schemas, and example payloads into a CompareRunner configuration that can be submitted as a full load test run with a single click. The gap between "execute individual requests from a spec" and "generate a test run from a spec" is a well-bounded data transformation problem. It is the next feature in the backlog, not an open aspiration.
When Not to Build Your Own
The three heuristics that justified building RESTRunner cut both ways.
Do not build if you require stateful session testing. If your scenarios involve multi-step flows with token passing, cookie state, or chained dependent requests — OAuth authorization code flows, e-commerce checkout sequences, multi-page form submissions — a stateless request matrix runner is the wrong architecture. K6's Virtual User model and Locust's task-based sessions are designed for exactly this use case. Use them.
Do not build if team-scale collaboration is a current requirement. RESTRunner's file-based storage is a feature in restricted environments and a hard ceiling in multi-user team environments. If your QA team needs shared test history, concurrent configuration editing, and audit trails today, a proper load testing platform with a database-backed configuration model is the appropriate investment.
Do not build if none of the three heuristics apply. If your team does not live in a single runtime, if your environment is not air-gapped, and if you don't have an existing canonical API definition to import from — use JMeter, use K6, use Locust. They are excellent tools. The argument here is not that building is better; it is that specific constraints make building the rational choice. In the absence of those constraints, it is not.
Final Thoughts
RESTRunner is not a better k6. It was never trying to be. It is a .NET-native load testing tool built to fit a specific workflow: start from your Postman collection, define target instances and test users, run the matrix, read the percentiles. It reflects exactly the problems a .NET developer encounters when building and maintaining .NET APIs — and resolves them with .NET-native solutions.
The four-year git history tells that story as a sequence of decisions, each of which proved the opening heuristics in practice: removing a convenience dependency to gain stack visibility (Heuristic #3); discovering a socket exhaustion failure that demanded the IHttpClientFactory pattern — a production bug only visible because the tools shared a stack (Heuristic #3 again); replacing average metrics with percentile distributions that actually expose tail latency; and normalizing response hashes to catch a stale cache serving three-hour-old data that every other metric declared healthy (the smoking gun that validated the entire project's existence).
Each decision was prompted by a real constraint and resolved by a specific .NET capability. That is what a good build-vs-buy outcome looks like: not "I built something because I could," but "the specific constraints of my environment had specific solutions that no existing tool could provide without architectural compromise."
The most durable lesson from four years on a tool like this: when the thing in your critical path is something you can own, own it. You will fix it faster, extend it more precisely, and benefit from every improvement the underlying platform makes. The vendor roadmap problem is real. The solution is a commit.