
DevSpark
Spec, build, validate, evolve
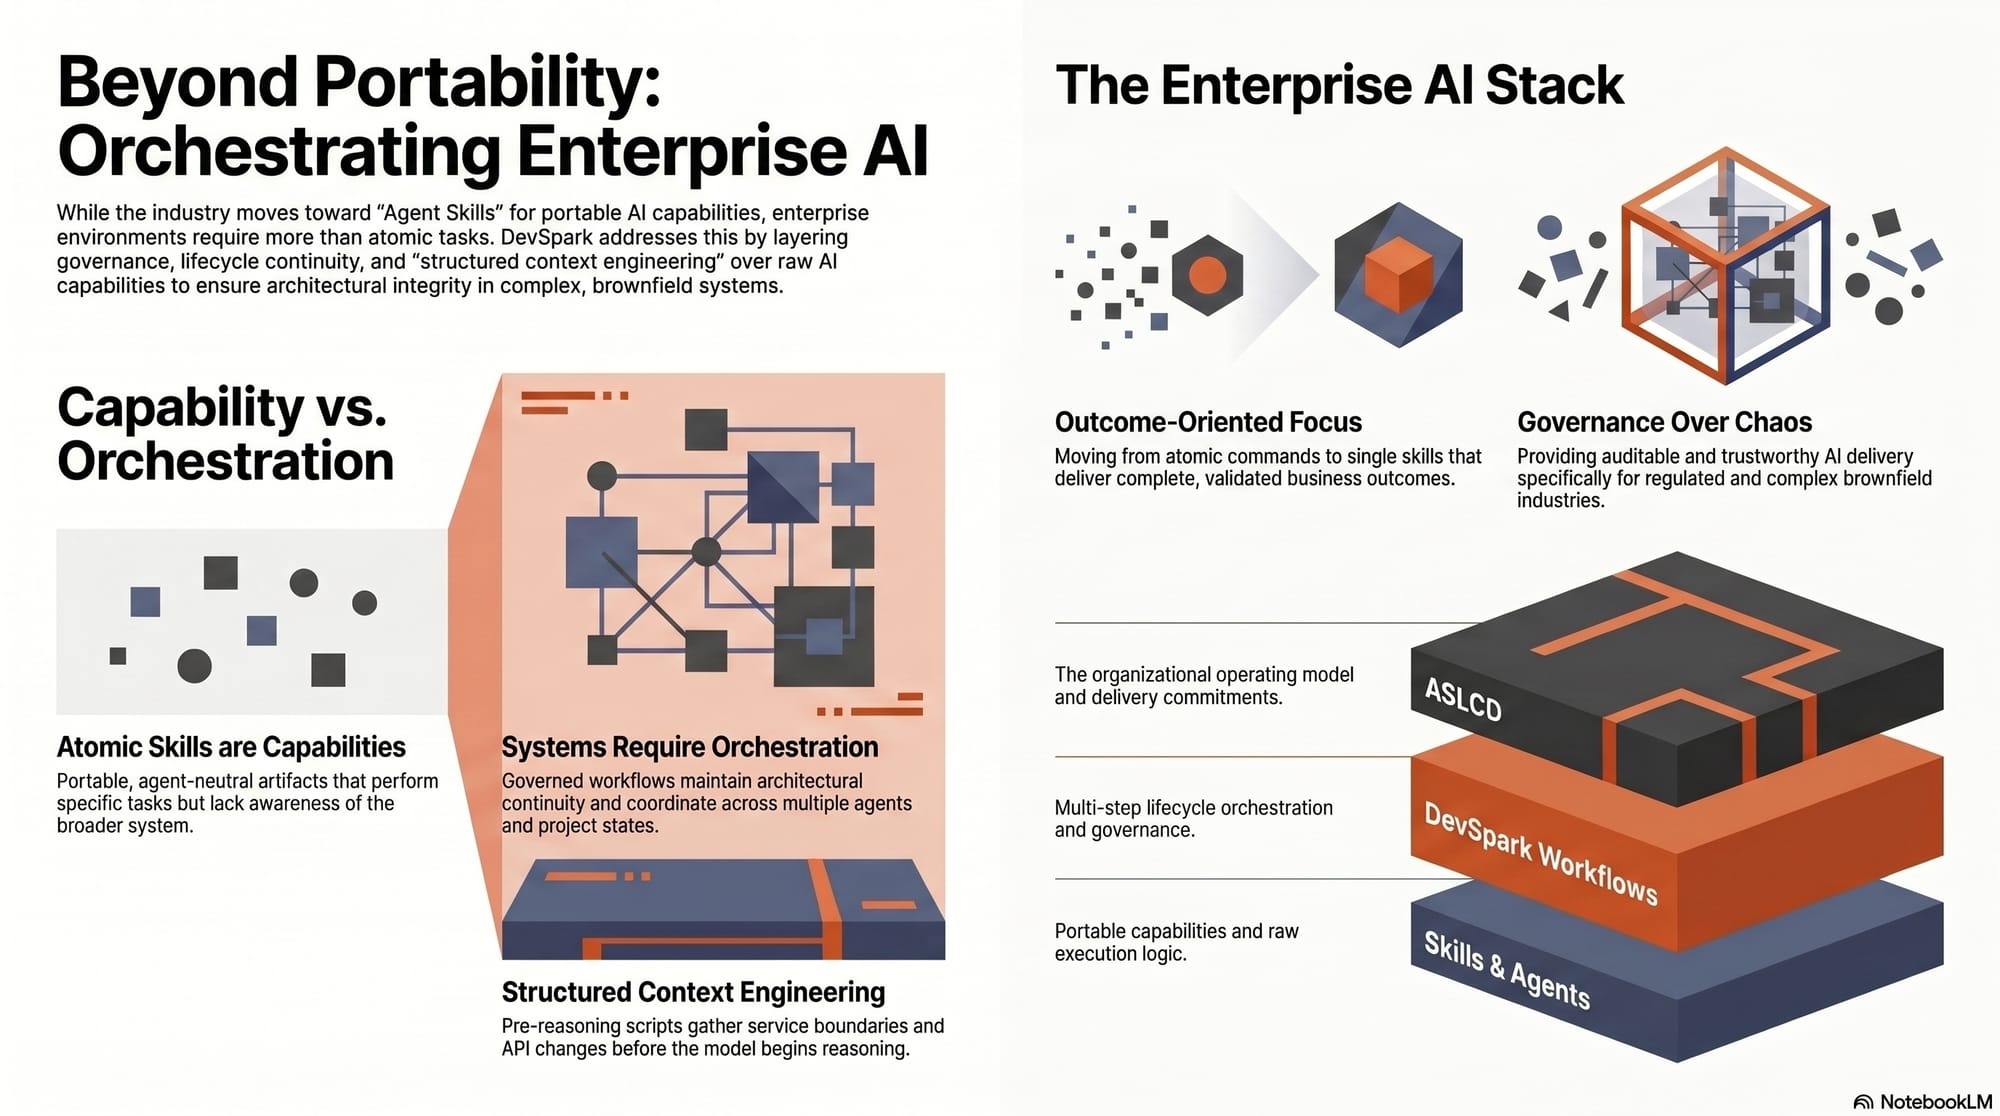
DevSpark is an implementation of Adaptive System Life Cycle Development (ASLCD), a full lifecycle model for building software with AI collaborators. It carries intent from specification through implementation, validation, and evolution.